

Quarterly Review
The second quarter delivered solid returns as our portfolio continued building on the foundation established in Q1's improved earnings momentum. Our portfolio has improved on its Q1 record, with almost 80% of companies reporting better-than-expected earnings. As we will discuss below, the structure of today's market means trending earnings have an outsized effect on returns.
Our half-year return was impacted mainly by lower Earnings Per Share (EPS) estimates due to tariff-driven economic uncertainty. For example, despite a favourable earnings season, expectations for our companies' earnings next year were revised lower. The other 493 stocks in the S&P 500 also experienced a 12% earnings revision, whilst the Magnificent Seven received a 3% upgrade.
The divergence in sentiment and earnings growth has been the crux of the stock market's performance for the past eighteen months. Similar to the dot-com bubble, it's a case of "Old Economy" vs. "New Economy" again—except this time, those dot-com "New Economy" stocks are now part of the old economy. The parallels between the two eras are starting to align closely. Consider the following themes common to both eras.
The Great Valuation Inversion (Compute Over Capital)
The modern version of "clicks over bricks" is "compute over capital." Value is now placed on proprietary models, processing power, and data rather than on traditional physical assets or even established customer bases.
Today's Headlines vs. 1999 Parallels:
- Today: "NVIDIA Now More Valuable Than Entire UK and French Stock Markets Combined"
- 1999: "Yahoo! Worth More Than Ford and GM Combined"
NVIDIA, by providing the essential "picks and shovels" (GPUs) for the A.I. gold rush, has achieved a valuation that dwarfs the gross output of major national economies. This highlights how foundational A.I. infrastructure is seen as more valuable than the diversified industries of entire countries.
- Today: "Are P/E Ratios Irrelevant? Wall Street Values A.I. Models on Parameters and Compute"
- 1999: "Is Profit Dead? Wall Street Says Eyeballs Matter More Than Earnings"
The new, highly speculative metrics for success are the size and efficiency of a company's A.I. models, its access to scarce GPU compute, and the quality of its proprietary data, replacing traditional valuation metrics.
The "Integrate AI or Die" Mentality
The narrative that every business must become an "AI business" is now widespread, creating immense pressure on legacy companies.
- Today: "AI Darwinism: 70% of CEOs Fear Their Company Won't Survive Without a Clear AI Strategy"
- 1999: "Digital Darwinism: Old Economy Giants Scramble to Survive Net Revolution"
A pervasive fear is gripping boardrooms globally. The narrative, pushed by consultants and tech giants alike, is that companies failing to integrate A.I. agents, copilots, and automation into their core processes will be rendered uncompetitive and obsolete within the decade.
- Today: "The Great Automation Panic: Is AI Coming for All White-Collar Jobs?"
- 1999: "From Main Street to the Web: Can Small Business Make the Jump?"
The societal stakes feel much higher this time. While the dot-com boom disrupted industries like retail and media, the A.I. boom is seen as a direct threat to a wide range of knowledge-worker professions (lawyers, coders, analysts, creatives), sparking a much broader and more anxious public conversation.
The Funding Frenzy and Market Concentration
While the IPO market isn't as wild as it was in 1999 yet, private funding rounds are astronomical, and a handful of AI-centric stocks are heavily skewing the public markets.
- Today: "The 'AI Five' Now Account for 40% of S&P 500's Total Value"
- 1999: "Nasdaq Smashes 4000 Mark, Fueled by Dot-com Darlings"
The stock market's record highs are almost entirely driven by a few key players (e.g., NVIDIA, Microsoft, Alphabet, Amazon, Meta). This extreme market concentration raises concerns about systemic risk should the A.I. narrative falter.
- Today: "A.I. Researchers Are Negotiating $250 Million Pay Packages, Just Like N.B.A. Stars" and "Thanks for Your $1 Billion Job Offer, Mark Zuckerberg. I'm Gonna Pass."
- 1999: No parallel—altogether unprecedented.
The intense competition for scarce A.I. talent and breakthrough models means Big Tech firms are willing to invest hundreds of millions, or even billions, into single employees and tiny, unproven startups, leading to a frantic and high-stakes battle.
The headlines represent the exuberant perceptions of the new technology; the reality is, of course, very different. At the end of the dot-com era, fundamentals eventually mattered. Very few companies became extinct. Online sales didn't replace brick-and-mortar (as of today, only 25% of retail sales are online). And 983 dot-com IPOs in seventeen months more than satisfied the funding frenzy.
There is a distinct air of FOMO (Fear of Missing Out) in the market. Pressure is mounting on traditional investors to catch the Magnificent Seven-driven indices, which forces normally rational investors to take greater risks. In our view, long-term returns are about the earnings. While the Magnificent Seven's earnings have significantly outpaced the market for the past two years, today's trend-driven market structure will equally reward other companies that produce positive earnings. Our companies are starting to regain their earnings power.
Portfolio Review
We ended the quarter owning 20 companies across diverse sectors and geographies, with the majority of holdings being acquirers—companies that actively deploy capital through strategic acquisitions to drive growth.
Portfolio activity during the quarter remained relatively low as we maintained conviction in our current positioning. Our primary focus was to build a newer position opportunistically and manage position sizes, including rebalancing for exposure and Total Shareholder Return optimisation. Strategic currency hedging remains in place.
Overall Portfolio Metric Highlights
Q2 produced some of the lowest volatility in 16 months, with meaningfully improved upside/downside capture ratios. Many of our companies' earnings profiles have finally normalised after peak COVID distortions, reducing earnings volatility and creating more predictable performance patterns.
Long-Term Performance Drivers
Despite near-term market complexities, we remain confident in our portfolio's ability to generate superior long-term returns. Our portfolio has superior fundamental characteristics relative to broader market indices, whilst trading at more attractive valuations. The market has been waiting for a turn in "other stocks" earnings for almost three quarters. Each quarterly disappointment has cost 1-2 turns in P/E multiples. However, we believe this cycle of multiple compression, caused by major regime shifts toward the Magnificent Seven, A.I., and momentum, has reached a trough, reducing the risk of further contraction.
Earnings Momentum
Our portfolio consists primarily of "Old Economy" companies, with no exposure to A.I. stocks. Like the broader market, these businesses have faced headwinds that pressured earnings per share growth. However, our Q2 results built meaningfully on the earnings momentum established in Q1, with stronger first-quarter performance providing a solid foundation for the second quarter.
We're beginning to see encouraging signs that our portfolio companies have reached an earnings inflexion point. For the first time in over a year, all but two companies exceeded market expectations. This improved earnings performance should help reduce negative momentum exposure while enhancing our upside/downside capture.
Market Analysis
We believe the tariff environment, while initially disruptive, will ultimately prove deflationary over the medium term. Initial price increases validate current Fed policy, but economic history suggests that higher prices inevitably reduce demand, creating competitive pressure that leads to a "race to the bottom" pricing dynamic. This sequence typically results in lower GDP growth, positioning the U.S. Federal Reserve to reduce rates once deflationary forces emerge. We expect the portfolio to perform well in an easier rate environment.
America's comprehensive tax legislation provides significant stimulus, particularly during the first two years of implementation. The legislation's provisions create meaningful consumer spending capacity. More importantly for our holdings, corporate benefits—including enhanced deductions and immediate expensing for manufacturing facilities—improve cash flow generation available for reinvestment.
As mentioned above, current equity market conditions require careful monitoring of developing exuberance indicators, which could counteract the positive headwinds.
Key Market Indicators
Chart 1: Momentum vs. Quality. This S&P Global chart shows momentum versus S&P Quality FCF Aristocrats. Interestingly, momentum now has a lower relative weighting to technology than Quality FCF, suggesting the rotation has reached unsustainable levels.
Source: S&P Dow Jones Indices LLC
Chart 2: Retail Capitulation. Retail holdings of a narrow group of stocks have pushed overall weighting to near all-time highs.
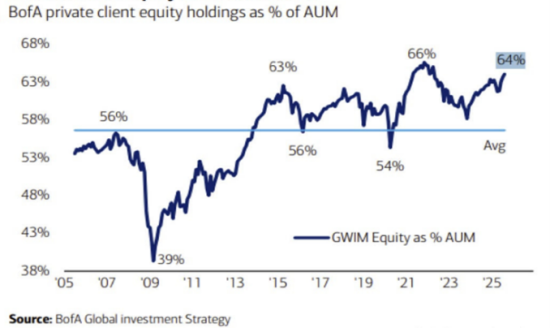
Chart 3: Concentration at Extremes. Market cap concentration data shows the top 100 companies now represent nearly 70% of index weight, while the bottom 400 have shrunk to historic lows. This level of concentration is unprecedented outside of the 1970s Nifty Fifty era.
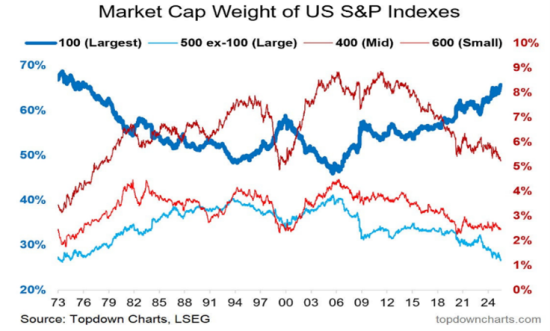
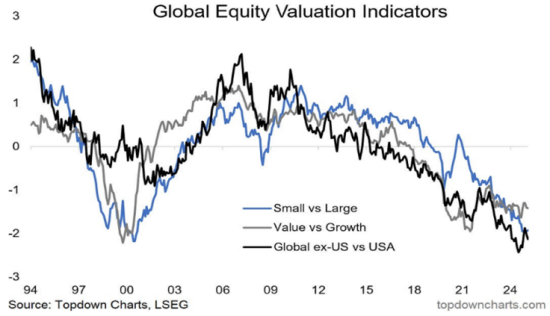
Chart 4: Valuation Troughs. The large-cap phenomenon has affected relative valuations globally. Small-cap, Value, and ex-US valuations are now at dot-com-era troughs relative to large-cap growth.
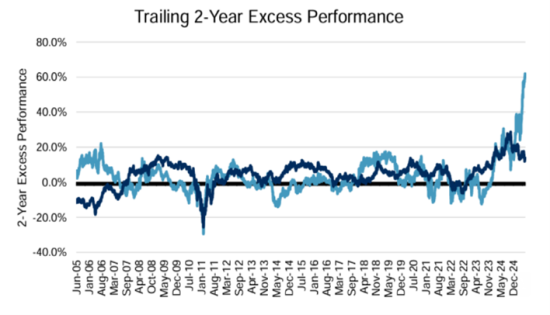
Charts 5 & 6: CDAM is an Anti-Momentum Portfolio. The Momentum Factor has dominated markets over the past two years, and negative earnings trends have hindered our portfolio over the past four quarters. However, we believe this headwind appears to be ending. Recent examples demonstrate that stocks transitioning from negative to positive earnings trends have generated exceptional returns.
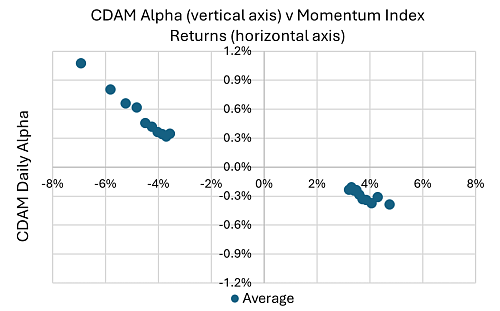
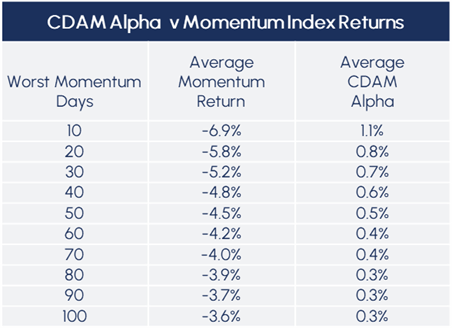
We believe these indicators validate our portfolio positioning. While markets have been captivated by speculative themes that have inflated valuations to unsustainable levels, we see this creating opportunity. As earnings growth normalises across the broader market, particularly among quality companies outside the Magnificent 7, we expect these fundamentally sound businesses to drive superior performance as valuations realign with underlying fundamentals.
Closing Remarks
As we navigate this fascinating period of market evolution, we remain optimistic about the opportunities ahead. Whilst the current AI-driven market presents near-term challenges, it has also created exceptional value in high-quality businesses that the market has temporarily overlooked. Our portfolio companies are demonstrating the earnings recovery we anticipated, with 80% beating expectations this quarter and many positioned for accelerating growth as economic uncertainties resolve.
The parallels to the dot-com era remind us that markets ultimately return to fundamentals, rewarding companies that generate sustainable cash flows and deploy capital wisely. We believe we are approaching an inflexion point where our disciplined approach to valuation and quality will be rewarded as the market broadens beyond the current narrow leadership. With our portfolio trading at attractive metrics relative to the broader market, superior management teams, and multiple catalysts on the horizon, we are confident in our ability to deliver strong returns for our investors in the quarters ahead.
Note
This is a redacted version of CDAM's Q2 2025 Investor Newsletter. Should you be interested to learn more, please contact us by emailing ir@cdam.co.uk.
Disclaimers
This document and any attachments are intellectual property owned by CDAM (UK) Limited and are protected by applicable copyright and trademark law.
Certain information herein has been obtained from third party sources and, although believed to be reliable, has not been independently verified and its accuracy or completeness cannot be guaranteed.
This material is not an invitation to subscribe for shares or interests in any fund and is by way of information only. The information is as of the date(s) indicated in this document, is not complete, is subject to change, and does not contain certain material information regarding any CDAM investment strategy, including tax consequences and risk disclosures. No investment strategy or risk management technique can guarantee return or eliminate risk in any market environment.