

Quarterly Review
This was the most challenging quarter in our Strategy's history, driven by a combination of the SaaSpocalypse, the Iran war, and the continued bifurcation between AI beneficiaries and the rest of the equity market. Post-quarter, the portfolio has regained almost half of the loss.
The damage was concentrated, driven by an earnings miss, the de-rating of our three remaining software holdings, and a soft margin print. The middle of the book was broadly negative, as the war-related risk-off environment compressed valuations across cyclical, European, and small- and mid-cap names.
We have used this period of dislocation constructively. Two new positions have been added at multiples not seen in over a decade. The new investments move the portfolio away from AI-displacement risk by deliberately tilting toward proprietary data and regulatory-moat businesses. The section below offers our diagnosis of what has driven results, and sets out the catalysts we believe will drive the recovery.
Understanding the Underperformance
We take our responsibility to investors seriously, including being direct about underperformance. Our analysis of recent results points to four reinforcing factors that we believe account for almost the entire gap.
First, and most important, our portfolio EPS growth has been running at almost half its historic trend. We believe earnings growth is the long-term driver of all stock returns; when this slows, returns are impacted by both the lower growth rate and multiple contraction. The broader economy, the kicking part of the "K" economy (or everything ex-AI related), has gone sideways for almost two years. Median revenue growth across our cohort is approximately 6.7% today, down from 12% pre-COVID, and median EPS growth has collapsed from 16% to under 3%. This is the most important change in the Strategy's recent window, and it is cyclical rather than stylistic.
Second, the M&A flywheel that has historically driven our compounders has slowed sharply. Median acquisition spend across the rollup universe has fallen from approximately 39% of EV-to-sales pre-COVID to 24% today (a 15 percentage-point drop). With debt two to three times more expensive than the 2010-2019 era and seller multiples sticky from the 2021 peak, deals have stopped clearing. Less M&A means less inorganic revenue growth, which is precisely what our compounders depend on.
Third, we own quality companies that are being ignored or actively sold to finance AI purchases. The Strong Balance Sheet index has underperformed the Weak Balance Sheet index by almost 30%. Unprofitable Russell companies have outperformed profitable ones: the Long Momentum index has returned 131% cumulatively versus the Nasdaq 100's 66%. A strategy built on solid fundamentals at fair prices has been structurally in the wrong part of the factor space throughout this period. This is regime risk, not a stock-picking failure, and it is precisely the kind of dislocation that historically reverses sharply once the underlying speculative cycle breaks.
Fourth, our geographic and sector positioning has tilted away from the AI boom. Approximately half the portfolio sits outside the United States, in a period of sustained US dollar dominance, and the S&P 500 has outpaced the MSCI World by approximately 4 percentage points per year. Our sector exposure: industrials, materials, and consumer discretionary, captures essentially none of the multi-trillion-dollar AI capex flow. We do not own NVIDIA, the hyperscalers, or any AI infrastructure pure-plays, because they do not meet our strategy fundamentals thresholds or "fair price" discipline. That decision has cost us during this regime, but we believe the eventual reversion, when the capex cycle turns or when AI infrastructure overcapacity emerges, will be powerful.
None of this is offered as an excuse. We have made mistakes, and we have addressed them through pruning, position concentration, and the addition of two high-quality data-moat compounders this quarter. But the question we ask is whether the Strategy that has delivered our long-term track record remains intact. The answer, supported by operational results across our companies, is yes. The arithmetic of recovery is in our favour, even if the timing is not.
Current Market Environment
The Q1 2026 environment was shaped by two collisions: a geopolitical shock from the Iran war that reignited inflation fears, and the so-called "SaaSpocalypse", which saw the software sector experience its worst quarter since 2008. Beneath those headlines lies a more fundamental story: the most concentrated capital cycle in modern economic history, with consequences that increasingly shape every other corner of the market.
Consensus estimates show the largest AI hyperscalers spending $805 billion on capital expenditures in 2026, a 79% year-over-year increase and roughly 100% of their operating cash flows. To put that figure in context: it is comparable in scale to the entire Troubled Asset Relief Program (TARP) authorised during the Global Financial Crisis, except that hyperscaler capex is now an annual recurring number, not a one-off intervention. Looked at differently, $805 billion represents an enormous share of total US non-residential fixed investment; strip hyperscaler capex out of the GDP arithmetic and US growth in early 2026 is effectively zero. The sell-side estimates the cumulative capital effect at $7.6 trillion between 2026 and 2031 across compute, data centres, and power.
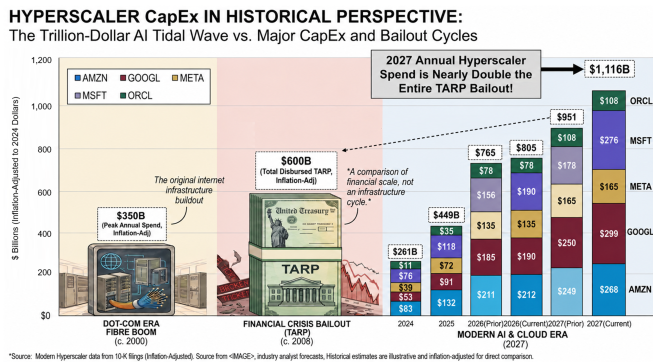
This capex behaves like an upstream flow of funds lifting everything it touches, but the contact points are narrow. Roughly 40–50% of the spend flows through NVIDIA, then TSMC, then ASML, a handful of companies in a single supply chain. Power and grid investment is the next-largest beneficiary, with US utilities planning $1.4 trillion in capital expenditure by 2030 and 2025 utility rate increase requests totalling $31 billion (more than double the prior year). The wealth-effect amplification is also concentrated: the top 20% of US households own nearly 70% of financial assets, and their spending, buoyed by appreciation in technology-heavy portfolios, contributed approximately 1.1 percentage points to 2025 GDP growth.
But this is not a broad-based stimulus. Unlike fiscal spending, AI capex leaks offshore (Taiwan, Korea, the Netherlands), employs few workers once deployed, and produces a wealth effect concentrated at the top of the income distribution. The result is a market and economy that looks strong in aggregate but reveals acute weakness beneath the surface: real-economy growth is anaemic, the median company is struggling, and quality businesses outside the AI supply chain are being sold to fund the buildout. The risk is that depreciation cycles (six years on paper but closer to two in practice) and an industry generating roughly $50–60 billion of annual AI software revenue in 2025 against $449 billion of annual spend will eventually force a reckoning. The historical parallels, the 1880s railroads, the late-1990s fibre buildout, are relevant. The builders went bankrupt; the consumers prospered.
Market Structure: From Buybacks to Capex to IPOs
A structural change in S&P 500 capital allocation is now underway and deserves attention. Sell-side research highlights that AI capex from the largest hyperscalers will grow 33% in 2026, while aggregate buybacks for the S&P 500 are forecast to grow just 3%. More tellingly, the hyperscaler cohort's share buybacks fell 64% year over year in the first quarter as cash was redirected to data centre infrastructure.
This matters for two reasons. First, buybacks have been the single largest source of marginal equity demand since 2010, supporting both index levels and earnings-per-share growth across the market. Their reduction at the hyperscaler level removes a meaningful technical bid from the largest US companies. Second, the shift signals that hyperscalers themselves are reaching the limits of what their cash flows can finance: companies are now borrowing in the corporate bond market at record levels ($100+ billion of gross issuance in 2025) to fund AI infrastructure, a pattern more consistent with government debt-financing than disciplined private investment. When the largest companies in the market collectively prioritise capex over capital return, the implications for the broader equity market multiple are significant.
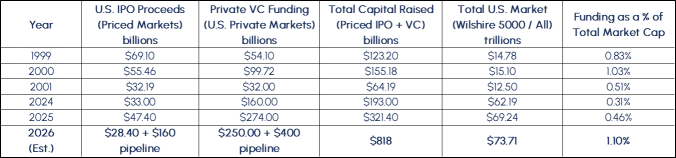
At the time of writing, inflation is pushing global interest rates higher, stock concentration and retail margin levels are making new highs, and momentum is five standard deviations away from its long-term trend. With nothing to stand in their way, these factors power markets to daily record highs. However, from June through the end of the year, markets are expected to absorb the largest supply of IPOs in history, both relative and absolute. To give some perspective, SpaceX, Anthropic, and OpenAI alone will need over $125 billion in new capital and will exceed the entire dot-com IPO wave of 1995–2000. They will not be alone. History shows that once an IPO cycle starts, it tends to snowball. Following the IPOs, private investors will be progressively unlocked, triggering multiple waves of selling. That much new equity supply consistently hitting the market creates a math problem: the money has to come from somewhere.
Portfolio Fundamentals
Our portfolio's valuation remains extremely compelling. The P/FCF multiple has historically traded in line with the MSCI World Index but currently sits 47% below historical norms. Although growth expectations have come down across the market, our compounders continue to grow almost twice as fast as the MSCI World Index. Combined with materially superior returns on equity, this provides the ideal backdrop for long-term outperformance. Our companies reinvest 80% of their profits, almost twice the level of the broader market, fueling sustained compounding. EPS growth equals ROE multiplied by reinvestment rate, and on both metrics, our portfolio is significantly advantaged.
Our Foundational Formula: Total Shareholder Return = Owner Earnings Growth + Dividend Yield + Change in P/E Multiple.
Our projections include sell-side estimates of strong annual earnings growth and meaningful expansion in the price-to-earnings multiple over the next three years. We expect these twin engines of return, plus a modest dividend, to deliver an outsized annualised return over the next three years, more than twice the market's projected return. The current dislocation between our portfolio's earnings trajectory and its stock price performance cannot persist indefinitely. As returns inevitably converge with EPS growth, we anticipate significant outperformance.
Deep Dive: Surviving the SaaSpocalypse
The iShares Expanded Tech-Software Sector ETF fell approximately 24% in Q1 2026, the worst quarter for software since Q4 2008. Relative to the S&P 500, software's drawdown represents a 21% underperformance: exceeding the sector's drawdowns during the dot-com bust, the Global Financial Crisis, and the 2022 rate-hike shock. This makes it the worst relative drawdown ever recorded for software. The market has decided that AI agents will hollow out per-seat licensing, that vibe-coding will commoditise software production, and that LLM providers will build directly into the application layer. We think this is correct for some software and badly wrong for the rest.
Our framework rests on a complexity ladder:
Tier 1: Simple tools like logo design, basic websites, or generic chatbots with no data moat, no integrations, and no compliance burden. AI replicates its output directly, and pricing has already collapsed.
Tier 2: Single-purpose SaaS without proprietary data. Substituted easily by AI, pricing is eroding.
Tier 3: Workflow and vertical SaaS, which involves hundreds of integrations, audit-trail liability, and embedded enterprise workflows. AI augments rather than replaces, and pricing power remains intact.
Tier 4: Systems of record such as credit bureaus, ERPs, and regulated data platforms that hold proprietary data in walled gardens. AI strengthens the moat by extracting greater value from data that the incumbent alone holds.
Our remaining software holdings sit in Tier 3.
The most informative real-world analogue is Wix. Wix launched in 2008, selling DIY websites for $20 per month, while the professional design industry charged $20,000 or more, a 1,000x price differential, comparable to what AI offers versus generic SaaS today. Fifteen years later, Wix holds 45% of the website-builder market but powers only 4% of all websites and just 0.3% of the top 1,000. Professional web design did not die; it shrank into the jobs where the cost of failure exceeds the cost of doing it properly. Critically, this took 15+ years to play out, even with the disruptive technology mature on day one. The market is pricing software for an overnight collapse; the closest analogue suggests it takes more than a decade.
The valuation backstop is the asymmetry that makes this position attractive. Our three retained Tier 3 holdings are now cheaper than the broader SaaS index, cheaper than the S&P 500, and screen in the cheapest one-third of the US $20–200bn market-cap universe, a universe whose average expected sales growth is roughly 6%, well below what these three are guiding to. We are not contrarian on the sector; the SaaSpocalypse is real, with real victims, and we have acted accordingly. What we are contrarian on is the market's decision to apply the disruption discount uniformly across the complexity ladder. The framework, the Wix analogue, and the valuation backstop all point in the same direction: hold the Tier 3 and Tier 4 names through the noise.
Closing Remarks
As we navigate one of the most challenging quarters in our Strategy's history, we find it useful to revisit the period most similar to today: the late 1990s and the dot-com bubble. Between 1997 and 1999, quality and value managers underperformed dramatically as capital flooded into anything internet-related. By March 2000, many of the most disciplined investors in the world were enduring redemptions, public ridicule, and a market that seemed to have permanently changed. Then the bubble burst. Between 2000 and 2006, value and quality strategies did not merely recover; they generated cumulative outperformance exceeding 40% versus the indices, and previously neglected sectors delivered roughly 10% annualised excess returns over the following five years.
The parallels with today are striking. AI infrastructure spend is approaching a scale that rivals the largest fiscal interventions in modern history. Multiple expansion in mega-cap technology has accounted for the entirety of index returns over a multi-year period. Quality companies with strong balance sheets are being sold to fund speculative AI exposure. And the dispersion between profitable and unprofitable companies has reached extremes last seen in 1999.
We are not predicting the timing of a reversal. We are observing that every previous episode of this kind has ended the same way: with capital cycles turning, with overinvestment producing returns that disappoint, and with quality compounders re-rating from depressed multiples back to historical norms. Our portfolio today trades at 13x P/FCF, 47% below historical averages, while compounding earnings at twice the market rate. The arithmetic of recovery, once it begins, is powerful.
We remain fully committed to the process that delivered our long-term track record, and we are positioned for the recovery we believe is coming. The discomfort was unintended, but the long-term payoff will make it right.
We thank you for your continued trust and partnership through what has been a genuinely difficult period, and we look forward to discussing the portfolio's performance in better quarters ahead.
Note
This is a redacted version of CDAM's Q1 2026 Investor Newsletter. Should you be interested to learn more, please contact us by emailing ir@cdam.co.uk.
Disclaimers
This document and any attachments are intellectual property owned by CDAM (UK) Limited and are protected by applicable copyright and trademark law.
Certain information herein has been obtained from third party sources and, although believed to be reliable, has not been independently verified and its accuracy or completeness cannot be guaranteed.
This material is not an invitation to subscribe for shares or interests in any fund and is by way of information only. The information is as of the date(s) indicated in this document, is not complete, is subject to change, and does not contain certain material information regarding any CDAM investment strategy, including tax consequences and risk disclosures. No investment strategy or risk management technique can guarantee return or eliminate risk in any market environment.