

Quarterly Review
Q3 2026 turned out to be a relatively narrow quarter compared with how it started. The MSCI World rose 1.9%, and the S&P 500 rose 2.0%, but the average stock went nowhere: the equal-weighted S&P 500 fell 2.3%, and the Russell 2000 fell more than 7%. Three forces shaped the quarter: rising interest rates, with the 10-year Treasury yield up 88 basis points to 5.29% and the Federal Reserve raising rates for the first time in three years; a roughly 30% rise in oil as the Iran conflict continued; and, once again, the leadership of a small group of AI beneficiaries.
For our portfolio, the quarter had two distinct halves. In July and August, the Strategy returned +9.4% against +3.1% for the index, as the market rotated away from the AI winners. In September, it gave back much of that, as Treasury yields jumped and the average stock fell far more than the index. Our top five contributors added +8.4% and our bottom five subtracted -5.6%, with the middle of the book broadly flat.
Four themes stood out, and we take each in turn: the portfolio can benefit from rotation; interest rates are now weighing on the market; on AI, we believe we can do well either way; and the market remains bifurcated, with expectations for AI exceedingly high.
We are bottom-up fundamental investors, not macro forecasters. However, our fixed-income backgrounds help us understand how the cost of capital affects valuations. Liquidity, interest rates, and market concentration shape what investors are willing to pay. Recently, they’ve kept share prices far from fundamentals, so we monitor them closely.
Rotation
In July, the market rotated sharply away from the AI winners. UBS's AI Winners basket fell 18.5%, lagging the MSCI World by 19 percentage points, while the Strategy outperformed by 2.0 percentage points. In August, the gains broadened to our software holdings, which led the portfolio as the market began to reassess businesses it had priced as AI losers.
Over the two months, the Strategy returned +9.4% against +3.1% for the index, our strongest two-month outperformance since late 2023. That matters more than the headline number. When the market looks beyond a narrow group of AI beneficiaries, it rewards what we own: quality companies growing earnings at modest valuations. Our upside is no longer theoretical, but it depends on the market broadening.
The rotation has since become the market's main focus. In October, the Strategy outperformed the MSCI World by almost 2.6 percentage points. November has gone further, with the portfolio moving into significant outperformance as AI doubts continue to emerge.
Concerns about AI centre on two familiar questions: return on investment and the liquidity behind it. In August, we published a thought piece, "Liquidity: Generous Today, Tightening Tomorrow", outlining the three sources of cash supporting the market: fiscal deficits, accommodative monetary policy, and hyperscaler capital expenditure. Since the AI trade began, we have believed it was driven more by liquidity than by fundamentals. What has changed is that liquidity is now being tested.
Rates and Breadth
September's 54 basis point rise in the 10-year Treasury yield was its largest monthly increase in four years, high-yield corporate spreads widened by around 45 basis points, and the Federal Reserve raised rates by 25 basis points to 3.75-4.00%. Headline indices held up because a handful of large AI beneficiaries rose: UBS's AI Winners basket gained 7.5%. Beneath the surface, the market corrected. The equal-weighted S&P 500 fell 5.0% against 0.5% for the cap-weighted index, the equal-weighted MSCI World fell 4.3% against 1.2%, and nine of the 11 S&P 500 sectors fell.
Our portfolio fell further. We are heavily weighted to industrials and purposely lack AI exposure, and quality companies were sold as yields rose, despite their low debt. We are watching whether higher yields reflect stronger growth or a rising term premium. We believe most of the rise is term premium, which is the less benign of the two for equity valuations.
The fiscal tap is still running strongly, but the other sources are tightening. Massive bond issuance, higher interest rates, and wider corporate spreads are starting to limit available cash. The five largest hyperscalers issued an average of $28 billion of US corporate bonds a year between 2020 and 2024; in the first seven months of 2026 alone, they issued roughly $220 billion. The bond market is now charging more for it. Over the past twelve months, the average spread on a basket of hyperscaler bonds (Microsoft, Amazon, Alphabet, Meta and Oracle) has more than doubled, from about 69 to about 149 basis points over Treasuries, with the sharpest move in October and November. Chip makers' spreads stand about 35 basis points wider on the year, and the cost of data centre-related debt has almost doubled to junk status.
Risk Premium
The 10-year Treasury yield has risen by more than a percentage point this year, from about 4.2% to 5.3%, its highest level since 2002. According to the Shiller method, which compares the earnings yield on cyclically adjusted earnings with the real Treasury yield, investors now receive no extra return for owning the S&P 500 over Treasuries. That compares with an average premium of about 4.9% since 1900 and about 2.5% since 1990.
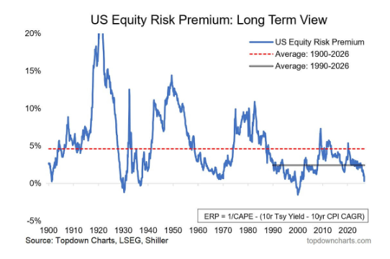
A zero risk premium leaves the market priced for continued delivery from a narrow group of companies. Higher discount rates weigh most heavily on long-dated growth expectations, as they did in September. They also undermine the "There Is No Alternative" (TINA) argument for equities: allocators can now earn a safer return at the same price. Because we believe most of this year's yield rise reflects the term premium rather than stronger growth, we see the current premium as more precarious than the headline figure suggests.
The private markets are sending the same signal. OpenAI's latest funding round was reportedly cut from a $30 billion target to about $20 billion, with a valuation lowered from $1.4 trillion to $1.25 trillion, around $11 billion secured so far, and a "tepid" response from some large investors. Valuation expectations for Anthropic's IPO have reportedly fallen from $1.5-2 trillion to $1.1-1.4 trillion, with the amount to be raised being set during the roadshow. Investors now need lower valuations to meet these companies' funding requirements. Coming after the hyperscalers' rush to the bond market, this suggests that investor appetite, or the pool of available cash itself, is close to its limit.
This matters because, as we set out in August, the hyperscalers are the conduit through which this liquidity reaches the economy: their spending is everyone else's revenue. Capital expenditure now faces a real risk of being cut, either forced by the market as funding costs rise or chosen by management as returns are scrutinised. Either outcome would have dramatic effects on the narrow group of companies driving both the market and the economy, and a market priced with no risk premium has little room to absorb them.
AI: Two Outcomes, One Portfolio
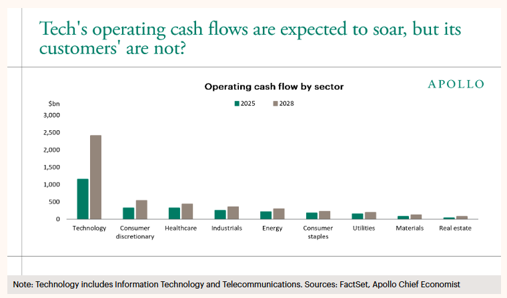
Analysts covering technology expect the sector's operating cash flow to more than double to about $2.4 trillion by 2028, an increase of over $1.2 trillion. Analysts covering its customers, the rest of the S&P 500, expect far smaller gains. As Apollo's Chief Economist puts it, both cannot be right at the same time. We think our portfolio is positioned for either outcome:
- If AI works, its customers must earn a return on what they spend, so the productivity gains should show up in the margins of the companies that use AI. That is what we own: industrial, healthcare and service businesses with pricing power, and software companies with proprietary data and workflows. We would expect their earnings growth to accelerate.
- If AI is overvalued, the cash-flow forecasts are too high and today's leaders de-rate. Capital then rotates towards companies whose earnings do not depend on AI spending, as it did in July, when UBS's AI Winners basket fell 18.5%, and our portfolio rose.
A Bifurcated Market
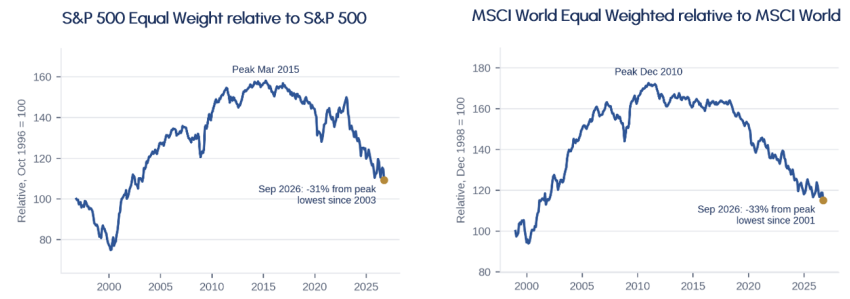
Market leadership remains extremely narrow. Relative to their cap-weighted indices, the equal-weighted S&P 500 and the equal-weighted MSCI World are at their lowest levels since 2003 and 2001, respectively. Both have fallen by about a third from their peaks. A small group of the largest AI beneficiaries has left most companies behind.
Valuations tell the same story. US technology trades at more than double the market's valuation, the highest premium since the dot-com era, while defensive sectors trade near their deepest discount on record. The S&P 500's cyclically adjusted P/E is 39x, a level exceeded only around 2000. In short, the market is paying its highest premium for AI growth since 2000, and a near-record discount for predictability.
Portfolio Activity
Portfolio activity was again higher than average in Q3 2026. We exited two long-standing positions in September and initiated a new 2.5% position.
At quarter-end, the portfolio held 20 long investments, with gross exposure of 96% and the top ten positions accounting for 60% of NAV. Our largest single investment was 8%. Strategic currency hedging remains in place, with the portfolio maintaining approximately 25% long exposure to non-USD currencies.
Health Care led in Q3, contributing +4.13% from a 14.86% quarter-end weight. Information Technology added +2.85%. Industrials, our largest sector exposure at 42.89%, detracted -2.84%. Geographically, the United States was the largest contributor at +4.36% from a 40.78% weight, while Canada detracted -2.01%.
Portfolio Fundamentals
Our portfolio has continued to cheapen while the market has become more expensive. Since September 2024, our price-to-free-cash-flow multiple has been broadly unchanged, moving from 14.6x to 14.7x, while the MSCI World's has risen from 22.3x to 24.3x. We now trade 40% below the market on that measure, with almost double the growth rate and 50% more free cash flow return on equity.
Our Foundational Formula remains: Total Shareholder Return = Owner Earnings Growth + Dividend Yield + Change in P/E Multiple.
On that framework, our projections include low-teens annual owner earnings growth and high single-digit expansion in the price-to-earnings multiple over the next three years. We expect these twin engines of return, plus a modest dividend, to deliver an annualised return over the next three years of almost double that of the MSCI World Index. The current dislocation between our portfolio's earnings trajectory and its share price performance cannot persist indefinitely. As returns converge with earnings growth, we anticipate significant outperformance.
Closing Remarks
The third quarter gave us both the evidence and the reminder. July and August proved what our portfolio can do when the market looks beyond a narrow group of AI beneficiaries: the Strategy outperformed the index by more than six percentage points in two months. September reversed somewhat as yields rose, but the rotation resumed in October and has gathered pace in November.
Neither changes the underlying arithmetic. On the Shiller measure, equities now offer no premium over Treasuries, and the market is paying its highest premium for AI growth since 2000. Our portfolio trades 40% below the market on free cash flow, with almost double the growth rate, and we project a 22% annualised return over three years against 12% for the index. If AI delivers, our companies should be among those that capture the productivity gains; if it disappoints, capital has historically found its way to cash-generative businesses at depressed multiples.
It is also worth asking who will ultimately benefit from AI. History suggests that the biggest gains rarely go to the companies that create a new technology. Industrial and manufacturing firms benefited more from electrification than the electrical companies that built it; software and services benefited more from the internet than the telecom companies that built it; consumer product companies capitalised on the transcontinental railroad; and platforms like ride-sharing were built on GPS and smartphones. We cannot yet know who AI's biggest beneficiaries will be, but we expect them to be among the businesses that use the technology rather than those that build it. Adoption takes years, the market is priced for months, and our portfolio is positioned accordingly.
We remain fully committed to the discipline that delivered our long-term track record, and we are positioned for the recovery we believe is underway.
Note
This is a redacted version of CDAM's Q3 2026 Investor Newsletter. Should you be interested to learn more, please contact us by emailing ir@cdam.co.uk.
Disclaimers
This document and any attachments are intellectual property owned by CDAM (UK) Limited and are protected by applicable copyright and trademark law.
Certain information herein has been obtained from third party sources and, although believed to be reliable, has not been independently verified and its accuracy or completeness cannot be guaranteed.
This material is not an invitation to subscribe for shares or interests in any fund and is by way of information only. The information is as of the date(s) indicated in this document, is not complete, is subject to change, and does not contain certain material information regarding any CDAM investment strategy, including tax consequences and risk disclosures. No investment strategy or risk management technique can guarantee return or eliminate risk in any market environment.